.png)
.png)


Discount Overview
The Discount Overview Report is designed to help you evaluate and optimize your discounting strategy. Use this dashboard to track your total discounts over time by category, brand, or vendor.
Discount Summary
At the top of the page, you’ll see a high-level summary of your discounting performance. Including:
- Percent Discounts – The percentage of gross revenue that was discounted during the selected time frame.
- Total Discounts ($) – The total dollar amount of discounts given.
- Total Net Revenue – Revenue after discounts are applied.
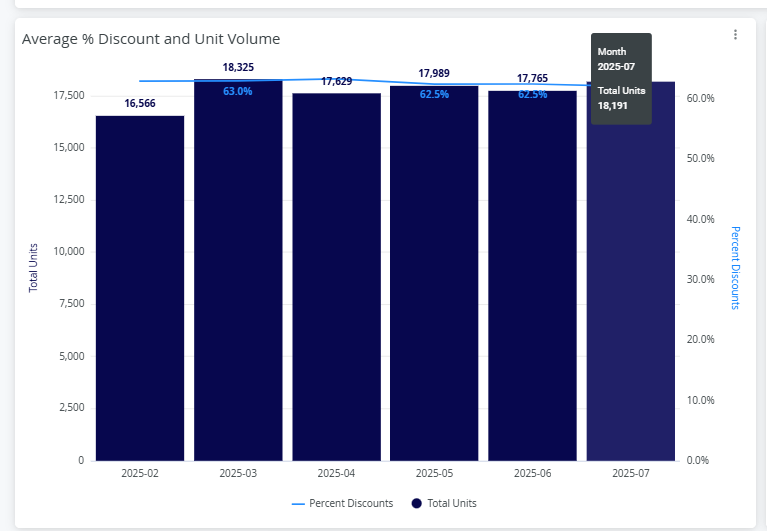
Average % Discount & Unit Volume
This tile shows how your sales volume and discount rates trend over time, based on your filters.
- Bars represent total units sold in your selected date range.
- Line represents the percent discount.
Hover over the bars to view total units, and hover over the line to see the discount percentage.
Revenue Discount & Percent Discount
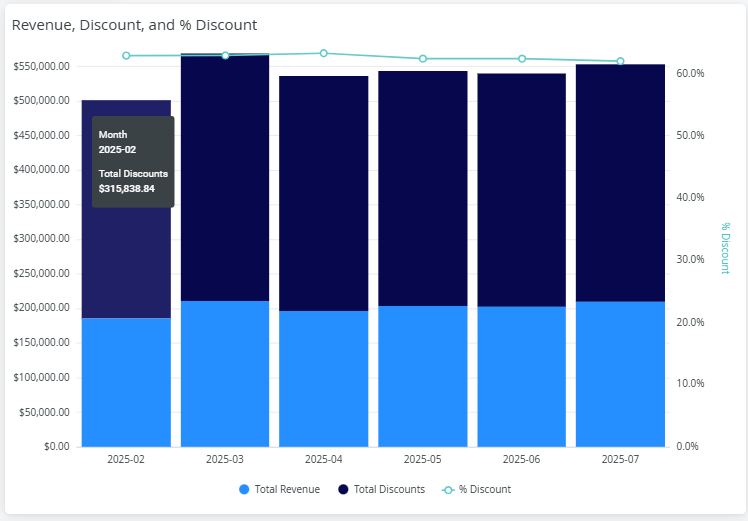
This visualization mirrors the one above but focuses on revenue:
- Bars show total revenue in light blue and total discount dollar amount in dark blue.
- Line shows the percent discount.
Average Item Price & Percent Discount by Attribute
This graph lets you analyze how pricing and discounting vary across:
-
Category
-
Vendor
-
Brand
-
Package Size
(determined by the "Slice By" filter)
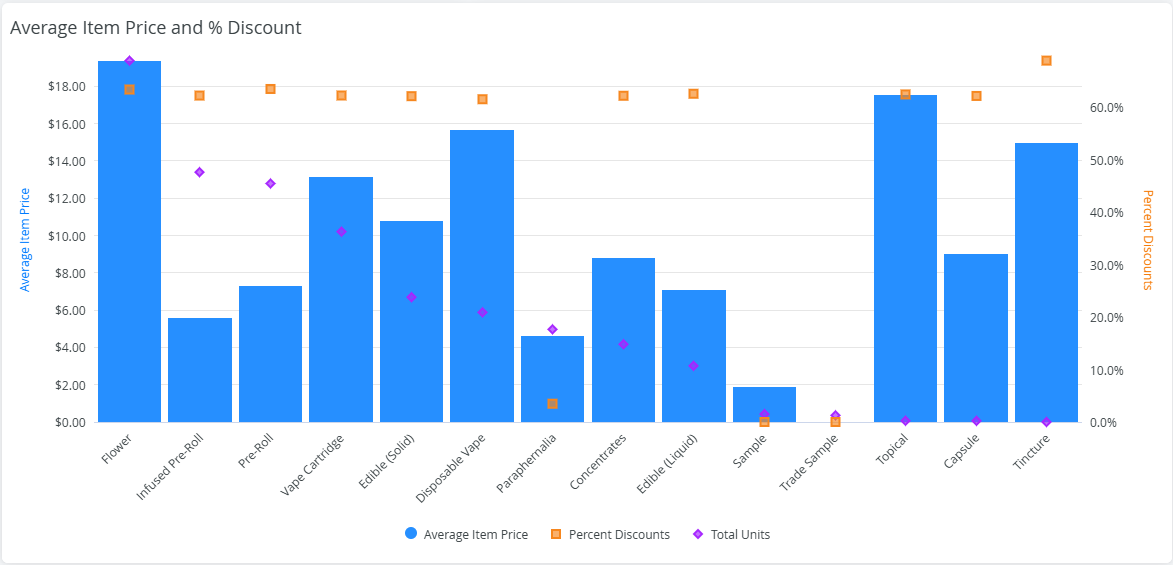
- Bars represent average item price.
- Squares represent discount percentages.
- Diamonds show total units sold.
- Hover over each shape for detailed metrics.
Unit Volume by Discount Bucket
This tile breaks down your sales by discount ranges (e.g., 0–10%, 10–20%, etc.).
- Discount buckets are labeled beneath the chart.
- Use this to quickly see where the majority of your volume is concentrated.
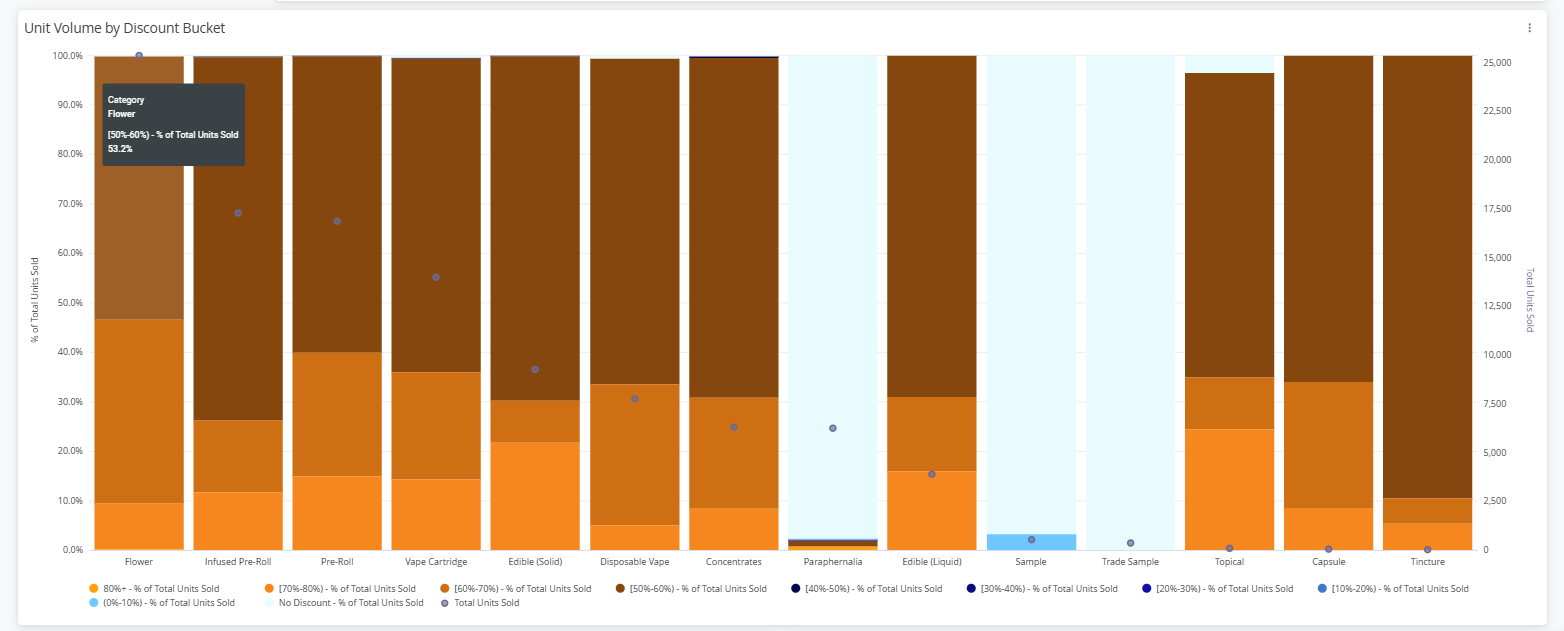
Hover over each bar to view the percent of sales tied to each discount bucket.
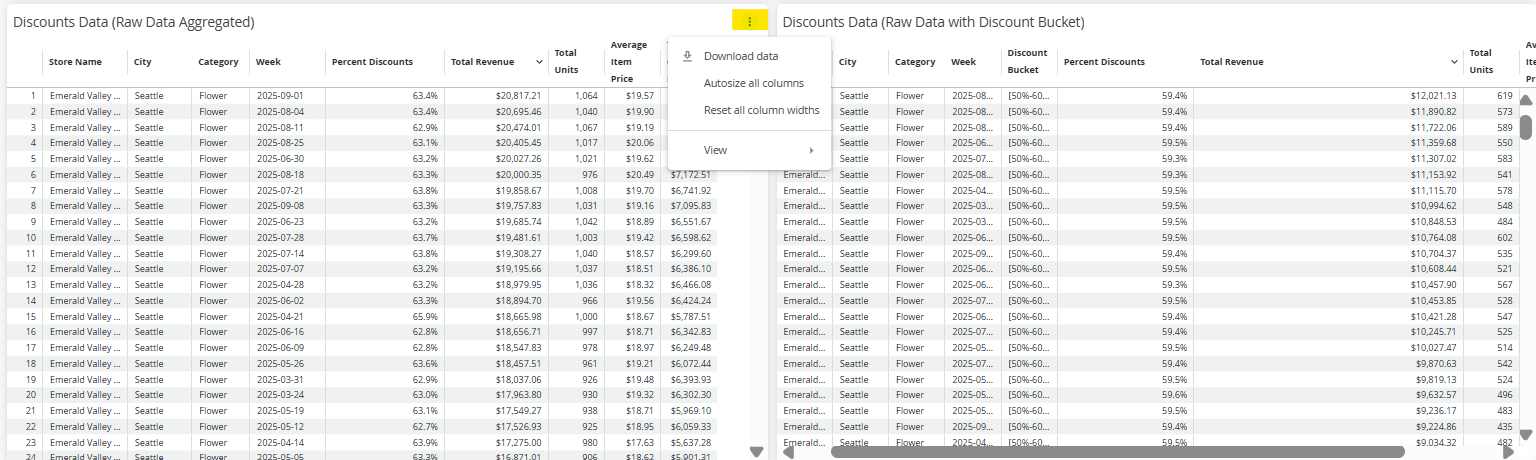
At the bottom of the page, you’ll find two discount data tables. The table on the left displays the raw aggregated data, while the table on the right includes the discount bucket.
You can hover over any column header to view definitions, and if you’d like to sort the data, simply use the arrows in the column header.
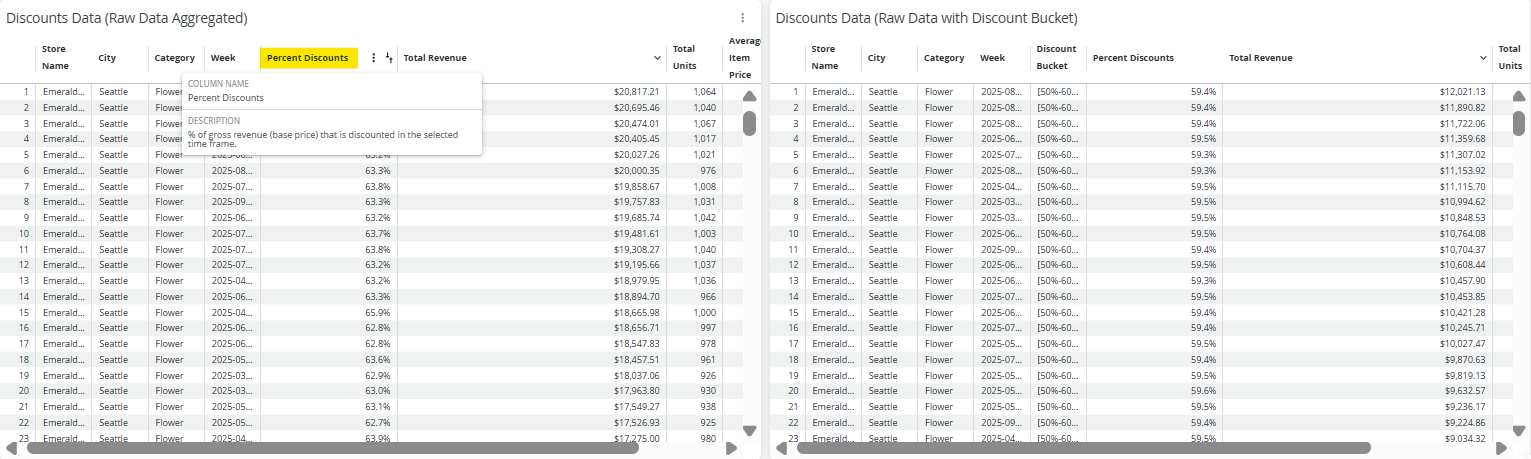
To download, click the three vertical dots in the top-right corner of either tile.