.png)
.png)


About this Dashboard
What is it?
This dashboard serves as a powerful tool for exploring the top attributes within a specific category. It enables you to identify the types of products with the largest market share and those experiencing the most significant growth.
Please ensure that you apply filters from left to right (in the following order):
- Country - which then narrows down the Market filter.
- Market
- Attribute - which then narrows down the Category filter.
- Category
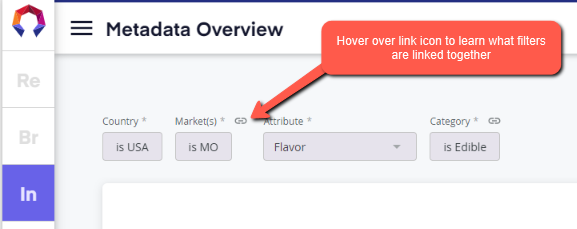
It's important to note that not all attributes are applicable to all categories. For instance, "Flavor" pertains to Edibles & Beverages, while "Strain" applies to Flower, Pre-Rolls, Concentrates, and Vapor Pens. For more information on which attributes are relevant to specific categories, refer to this article.
Why would you want this?
This dashboard provides answers to critical questions such as:
- Are there gaps in our product mix?
- Are there emerging market trends we should be aware of?
- Is there oversaturation in a particular attribute?
Within most of the visualizations, you can delve into each attribute to discover the specific brands associated with it and the proportion of their sales attributed to each attribute.
Last 90 Days of Sales & Month over month and Year over year
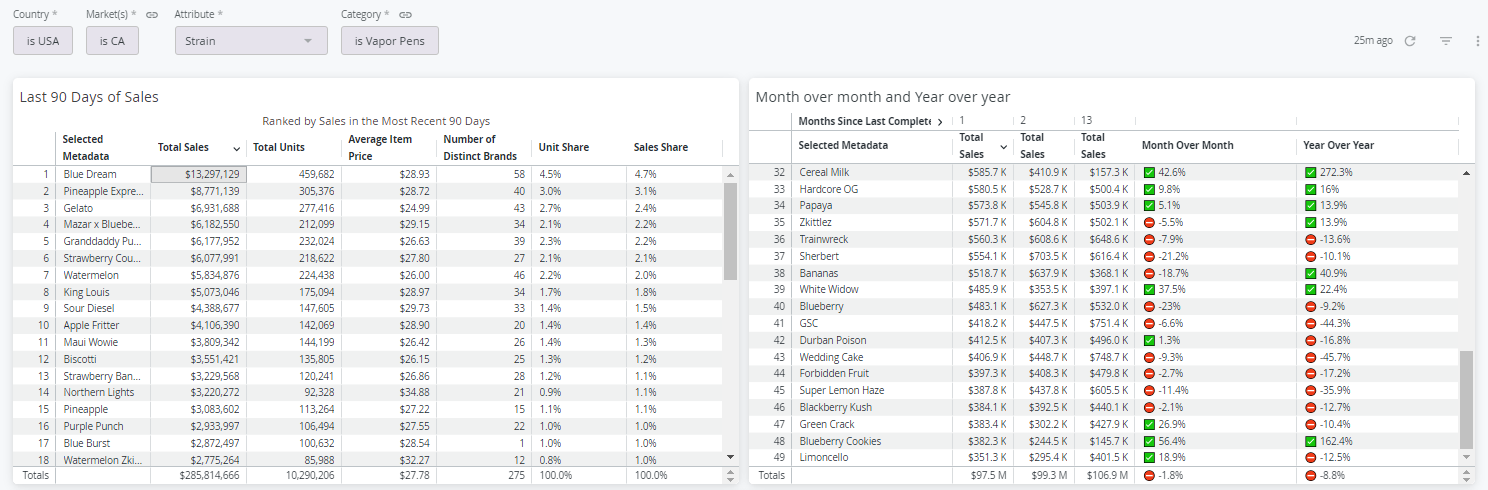
These two tables display the sales data for the last 90 days and the month-over-month (MoM) and year-over-year (YoY) growth of each attribute. The green & red boxes help provide a quick at a glance of trends and it’s very important to read the data in this table to get a complete picture. So what are we looking at here?
In Month over Month and Year over year, table:
- 1 = sales from the most recent closed month (ex. if it’s mid September 2023, these are sales from August 2023)
- 2 = sales from 2 closed months ago (ex. if it’s mid Sept 2023 this is July 2023)
- 13 = sales from 13 complete months ago (ex. if it’s mid Sept 2022 now, August of the prior year August of 2022)
Comparing columns 1 vs 2 provides the month over month view while comparing columns 1 vs 13 provides the year over year view.
The bottom ‘Totals’ row is sales from the total category in that timeframe. You can use these metrics to benchmark growth / decline in a specific attribute against the total category. For example here we see MoM Total Vapor Pens are down 1.8% while the individual attributes are seeing a decline of 2.1% to 23%. This lets us know that the general market decline is not the only factor in decreased sales in these strains. Let’s pretend a strain declined 0.8% - this strain would actually be actually up 1% vs the total market.
Top 20 Attributes (Last 90 Days) Sale Over Time
This visualization provides insights into the performance of the top 20 attributes over time.
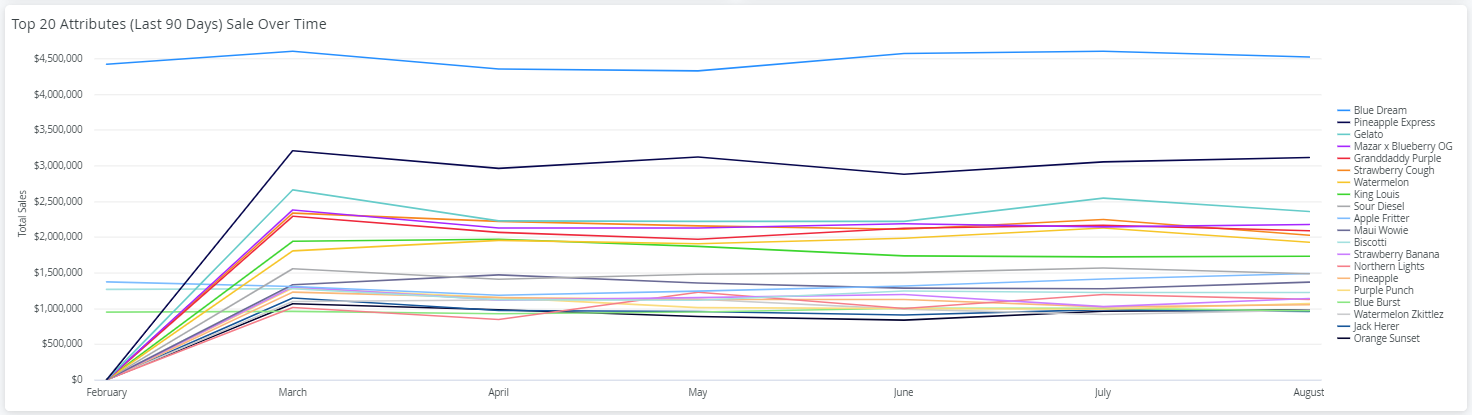
Tool Tip 💡 Click on an item in the legend to remove it from the graph. Combine ALT + click (option + click) to hone into a single item and click on additional attributes to compare. Repeate the compand to restore all items.
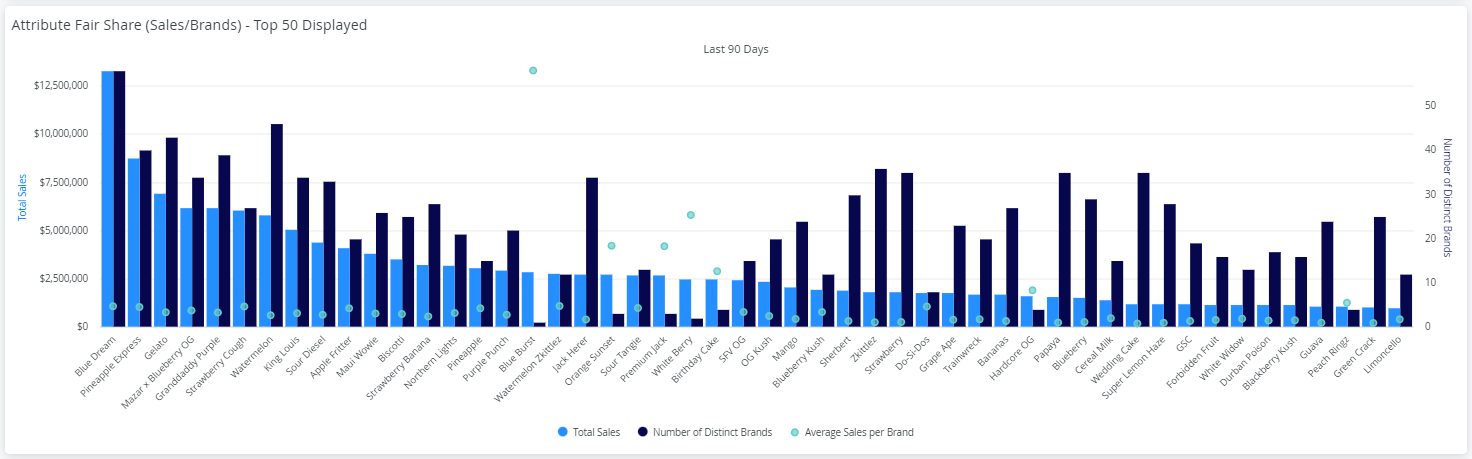
Attribute Fair Share (Sales/Brands) - Top 50 Displayed
This visual offers a comprehensive view of total sales for each attribute, the number of distinct brands selling each attribute, and the average sales generated by these brands for each attribute. Click on a bar to drill into brand level details.
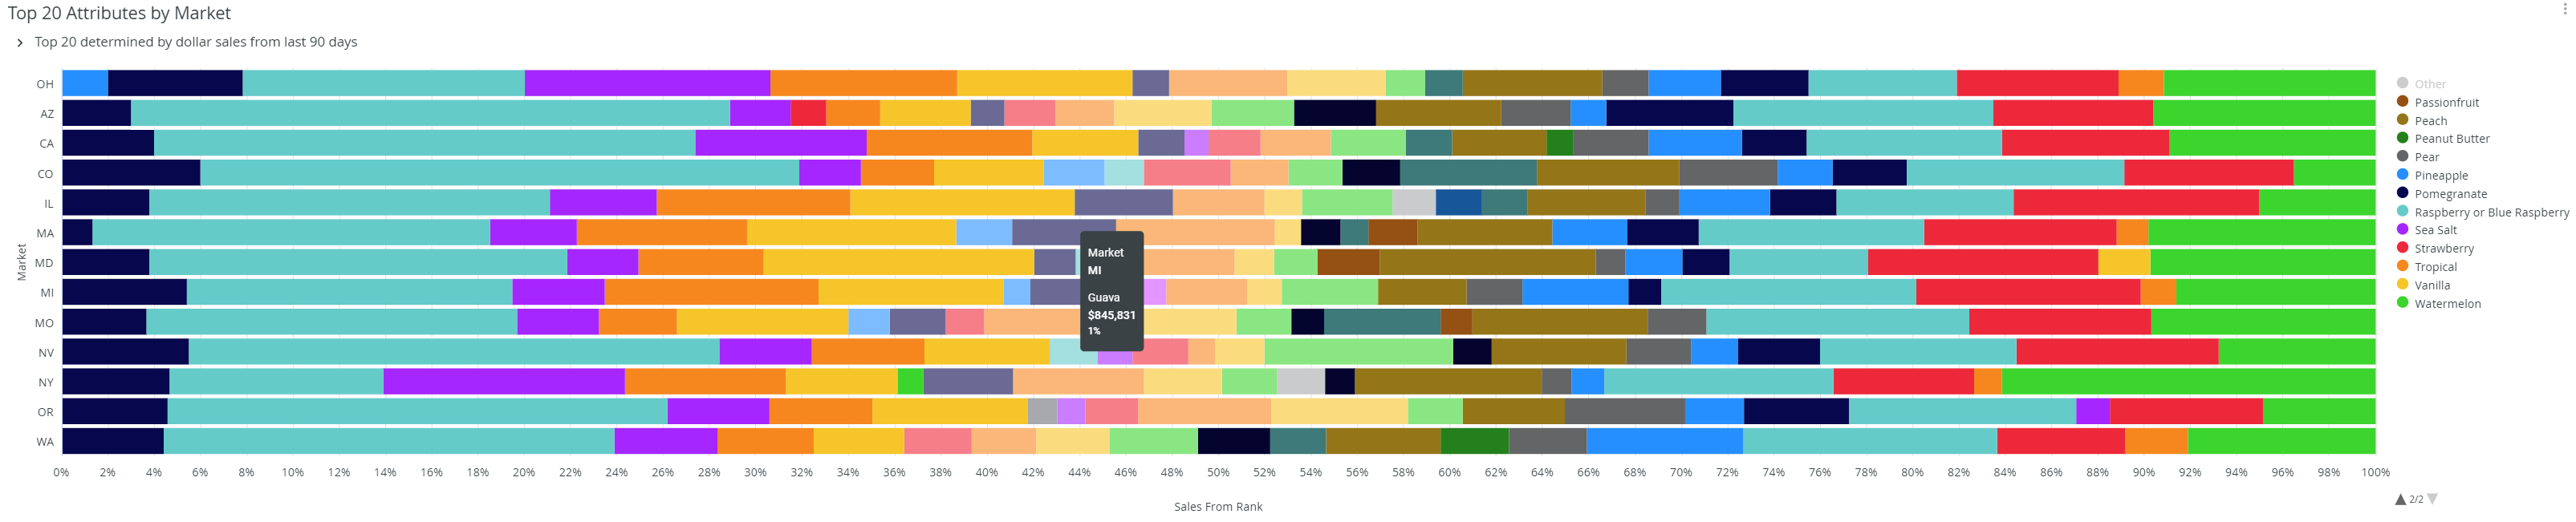
Top 20 Attributes by Market
Multi-market subscribers can compare attributes across markets. This is particularly useful for product innovation, white space analysis & understanding regional trends. For example, CO typically has a higher percent of sales towards mixed sour flavors than other US markets & we see this trend in Canada as well.
Top Attribute and Market Share by Market
Provides a table view for exporting the above visualization.

Top Brand / Attribute Combo (Prior 90 Days)
Highlights by brand & attribute combo top rankings by Total Sales (dollars). The table is great to export or you can toggle by clicking on the right hand side of the column header.

💡Tip: Want to see more than 90 days worth of data? Check out Metadata Over Time.


