.png)
.png)


Brand Compare: Sales Compare
About this Dashboard
This dashboard allows you to build a customized cohort of brands to compare based on your filtered selection.
Why Would You Want This?
In the realm of competitive analysis, understanding how your brand measures up against competitors and tracking the overall growth of specific brand groups is crucial. This dashboard equips you with the insights needed to answer questions such as:
- Which of the top 5 pre-roll brands in CA has experienced the most YoY growth?
- How many unique products do these brands offer?
- Are there untapped market opportunities?
- Who dominates particular package sizes or market segments?
To use this dashboard effectively, follow these steps:
- Set the date range to ensure trend line visualizations reflect complete months.
- Select the date granularity, Country, Market, and Category for analysis.
- Choose multiple brands for comparison using the multi-select filter.
- Slice data by the metric you want to gain insights from.
In the example below, the focus is on top pre-roll brands in California, aiming to gain a deeper understanding of competition between package sizes and identifying potential areas for product development.

💡Tool Tip: Not sure who the top brands are? Go to Category Details or Segment details where you can copy brands from the top brands tables and paste them into the brand filter here.
Sales Growth
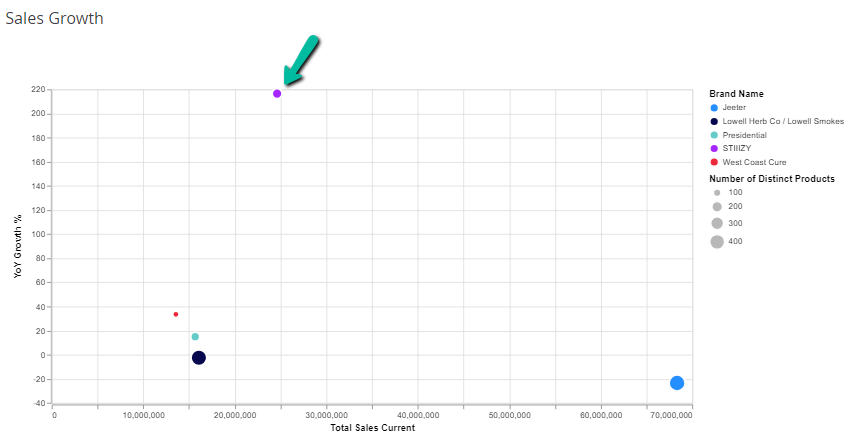
This visualization provides insights into rapid growth within the industry and identifies brands with the highest sales. For instance, Stiiizy has achieved significant YoY growth with a mid-size range of distinct SKUs.
Brand Overview
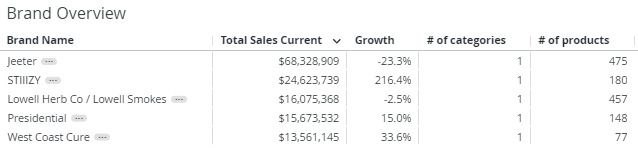
This table presents brand sales during the selected timeframe and their respective YoY growth. You can click the three dots next to a brand name to access 'Brand Details' for a deeper dive into brand performance.
Brand Sales Over Time
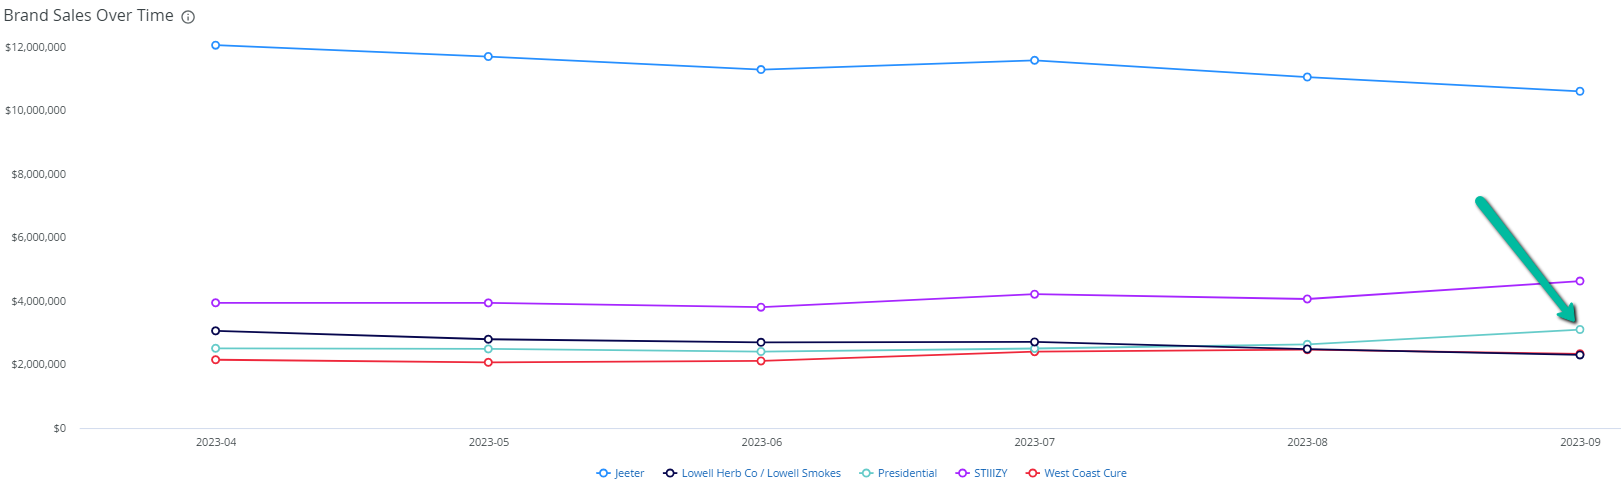
This trend line visualizes each selected brand's performance over time. While Stiiizy has achieved impressive YoY growth, the Presidential brand is gradually climbing the ranks. This suggests that Presidential is a brand worth monitoring closely.
Brand Sales and Brand Distinct Products
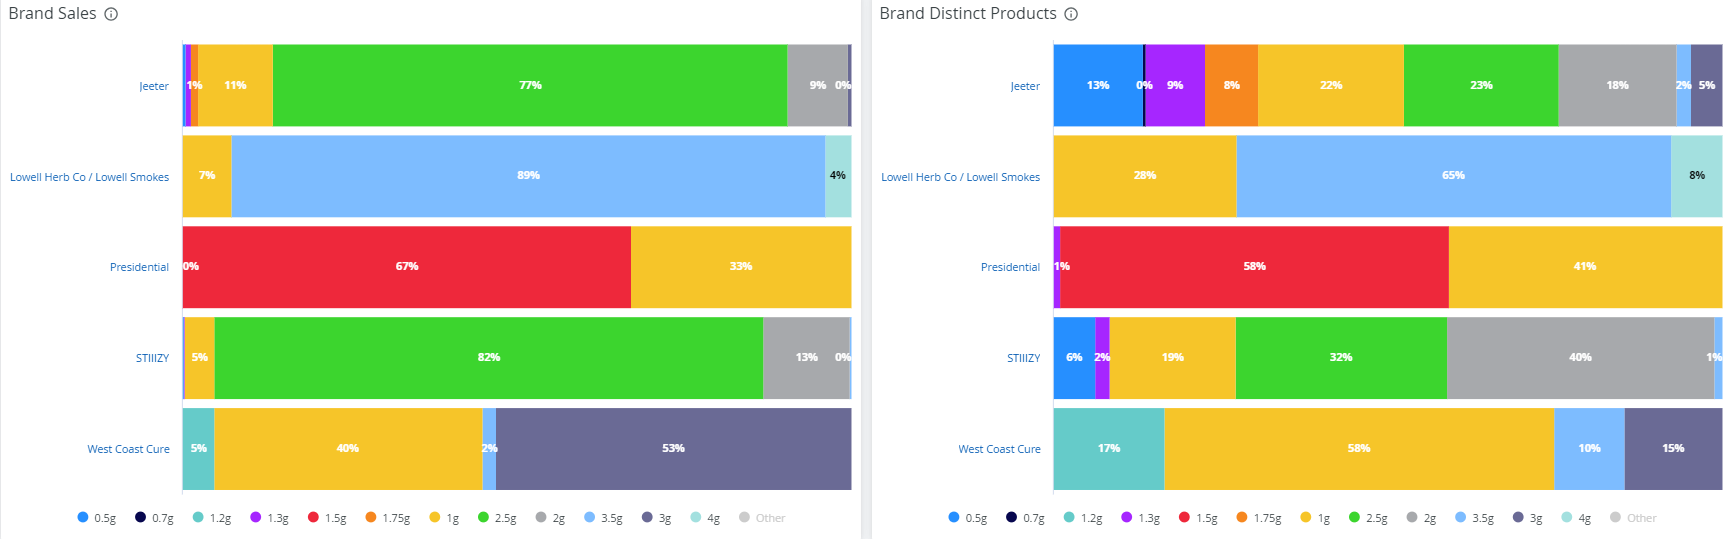
The colorful charts below represent package sizes within the pre-roll space and the percentage of each selected brand's sales attributed to these sizes. The bright red bar represents the Presidential brand, which gains a significant portion of its sales from the 1.5g package size, an option that few others offer. Lowell Herb Co similarly focuses on the 3.5g size.
The chart on the right provides insights into the number of distinct products offered by each brand. Jeeter offers a diverse range of products in various package sizes, while Lowell and Presidential primarily focus on two main sizes.
Segment Details
This table allows you to analyze sales, total units sold, average item price, unit cost, average EQ price, and cost.



