.png)
.png)


SALES STAFF
The Sales Staff Report is designed to give you deep insights into your team's performance across selected stores and time periods. Here's how to use it effectively:
At the top of the report, you’ll find filters that allow you to:
- Select a date range to analyze
- Choose one or multiple stores to include in the report
Once filters are set, click to run the report and view detailed sales metrics.
Sales Stats by Budtender
The first table you'll see is a visual breakdown of sales by each budtender.
- Hover over any bullet point on the graph to view individual metrics for that budtender:
- Average basket
- Total units sold
- Basket count
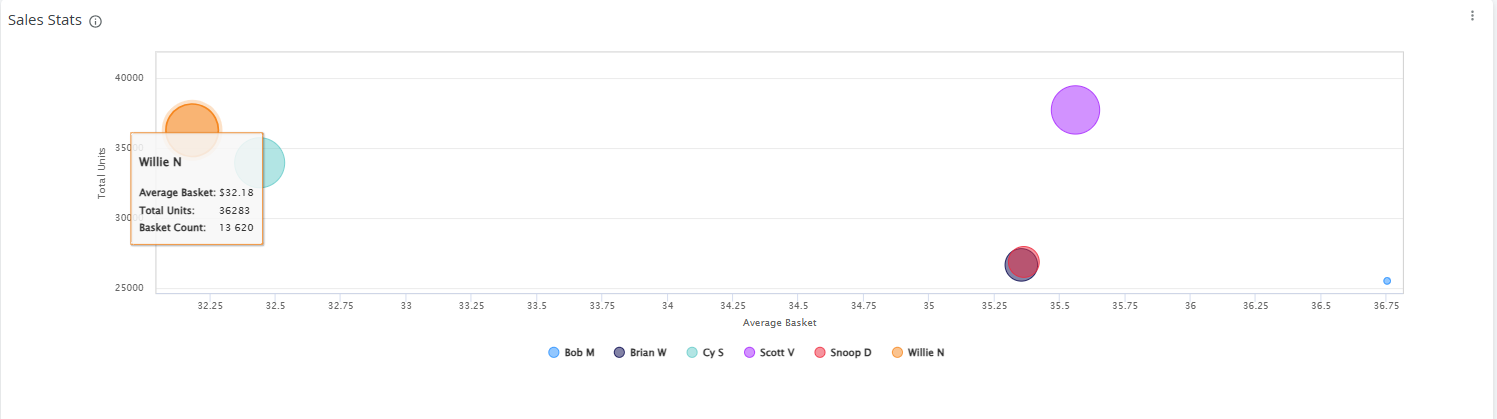
These metrics are all based on your selected date range and store(s).
Below the graph is an employee list table that includes the above data points as well as total revenue, total gross margin, and the percent of units discounted.

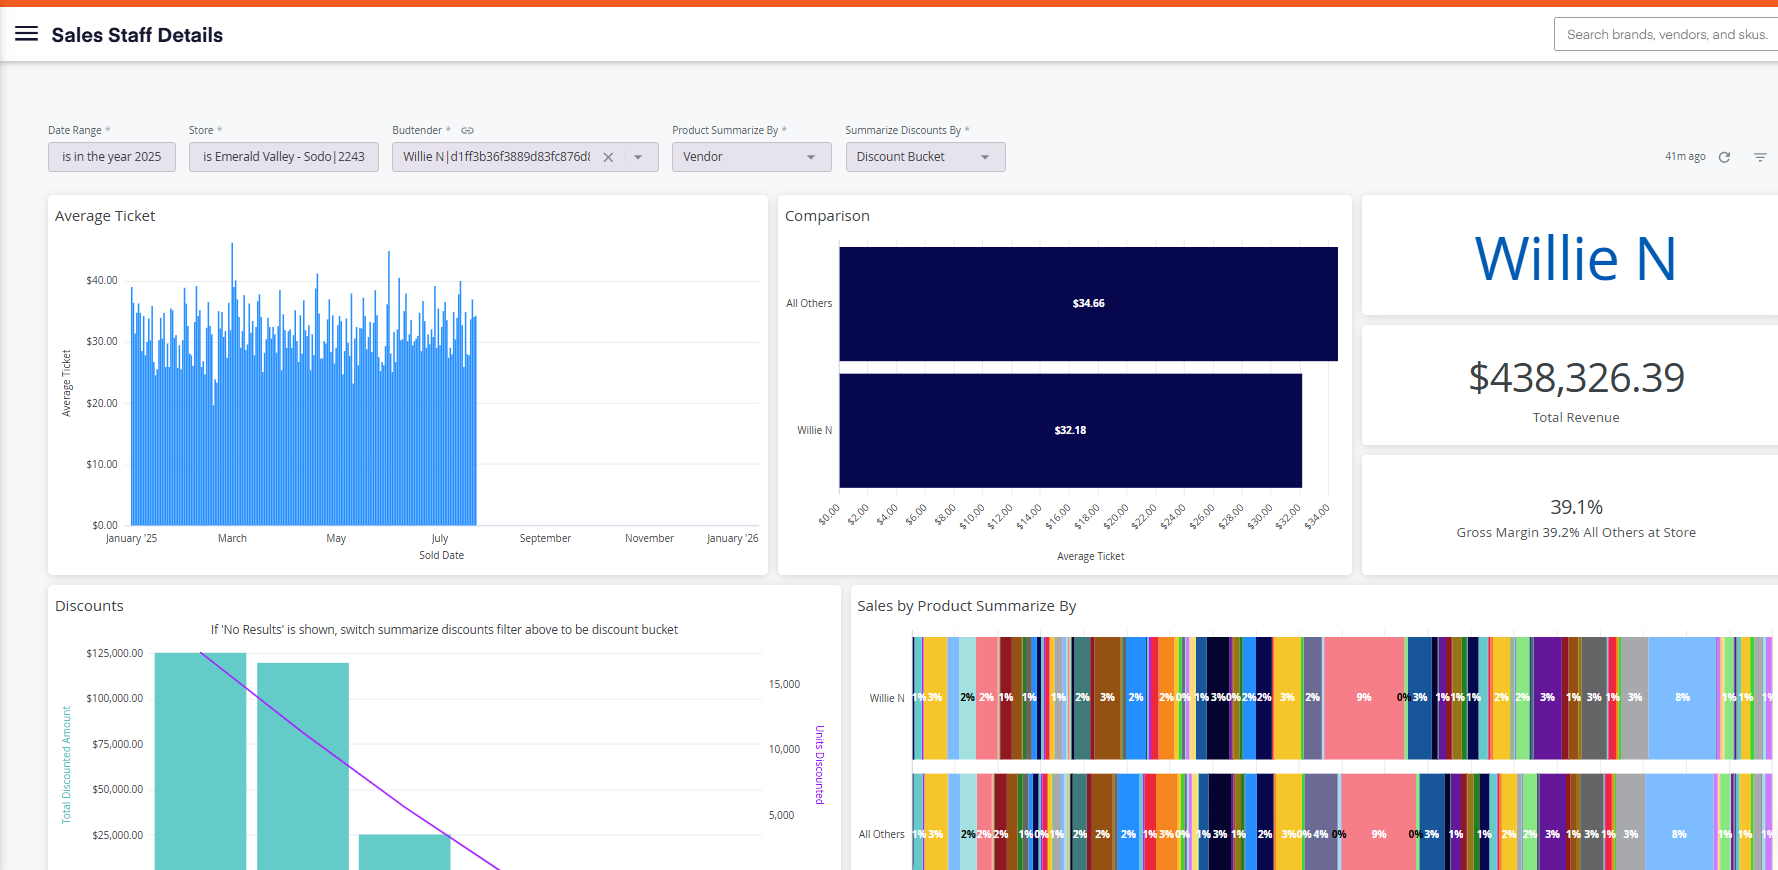
Click on any employee name in the list to drill down into their detailed sales performance.
The detailed view includes:
- Average ticket
- Comparison to other budtenders
- Total revenue
- Gross margin
- Discounts applied (if any)
- Sales by product
At the bottom of the report, you’ll find a sales data dump by product, summarized by your selected filter (e.g., product category, brand, etc.).
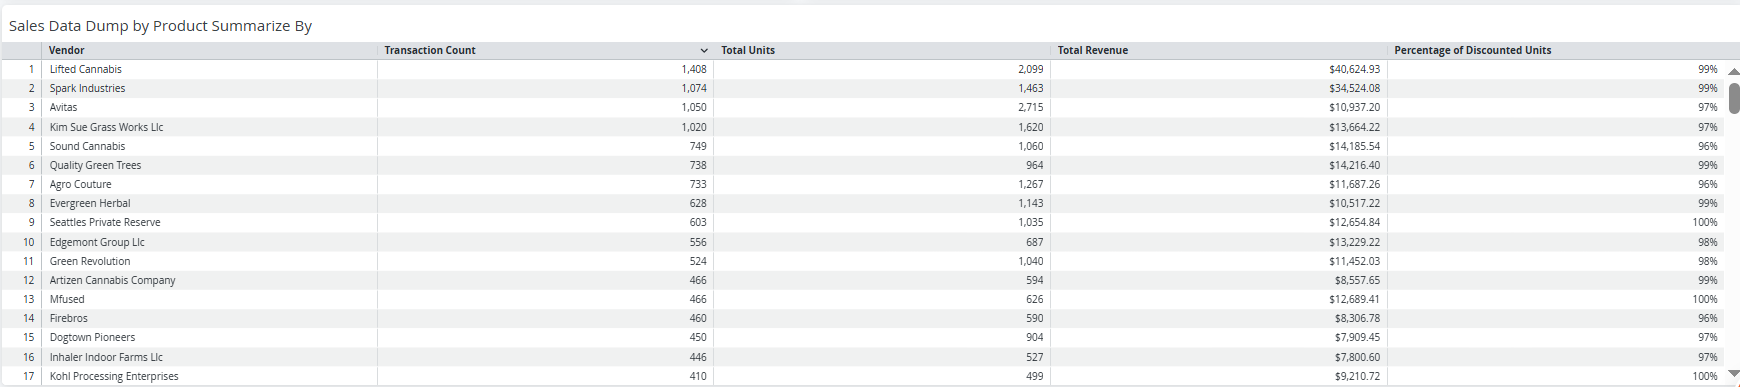
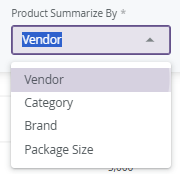
This table adjusts based on your selected "Product Summarized By" filter and gives you a detailed product-level view of sales performance.