.png)
.png)


CATEGORY-LEVEL DATA EXPORT
About this dashboard
What is it?
The Category-Level Data Export dashboard in Headset will help you capture almost all of the data from the category level dashboards to use outside of the system. Like all dashboards in the CATEGORY LEVEL module, this data is refreshed on the 1st of every month with the prior complete months worth of data. For real time data exports, visit the DATA EXPORT module.
Why would you want this?
Many people prefer to export the data into Excel and CSV formats to manipulate it to fit their specific needs. This can be for monthly reporting so you can update the data into custom branding for slides, add it to investor pitch decks or even simply to flip the orientation of a visualization.
If you find yourself exporting data more than spending time in app, please contact your Account Executive or Customer Success Manager to discuss our data cloud service, Headset Vault.
Data Download
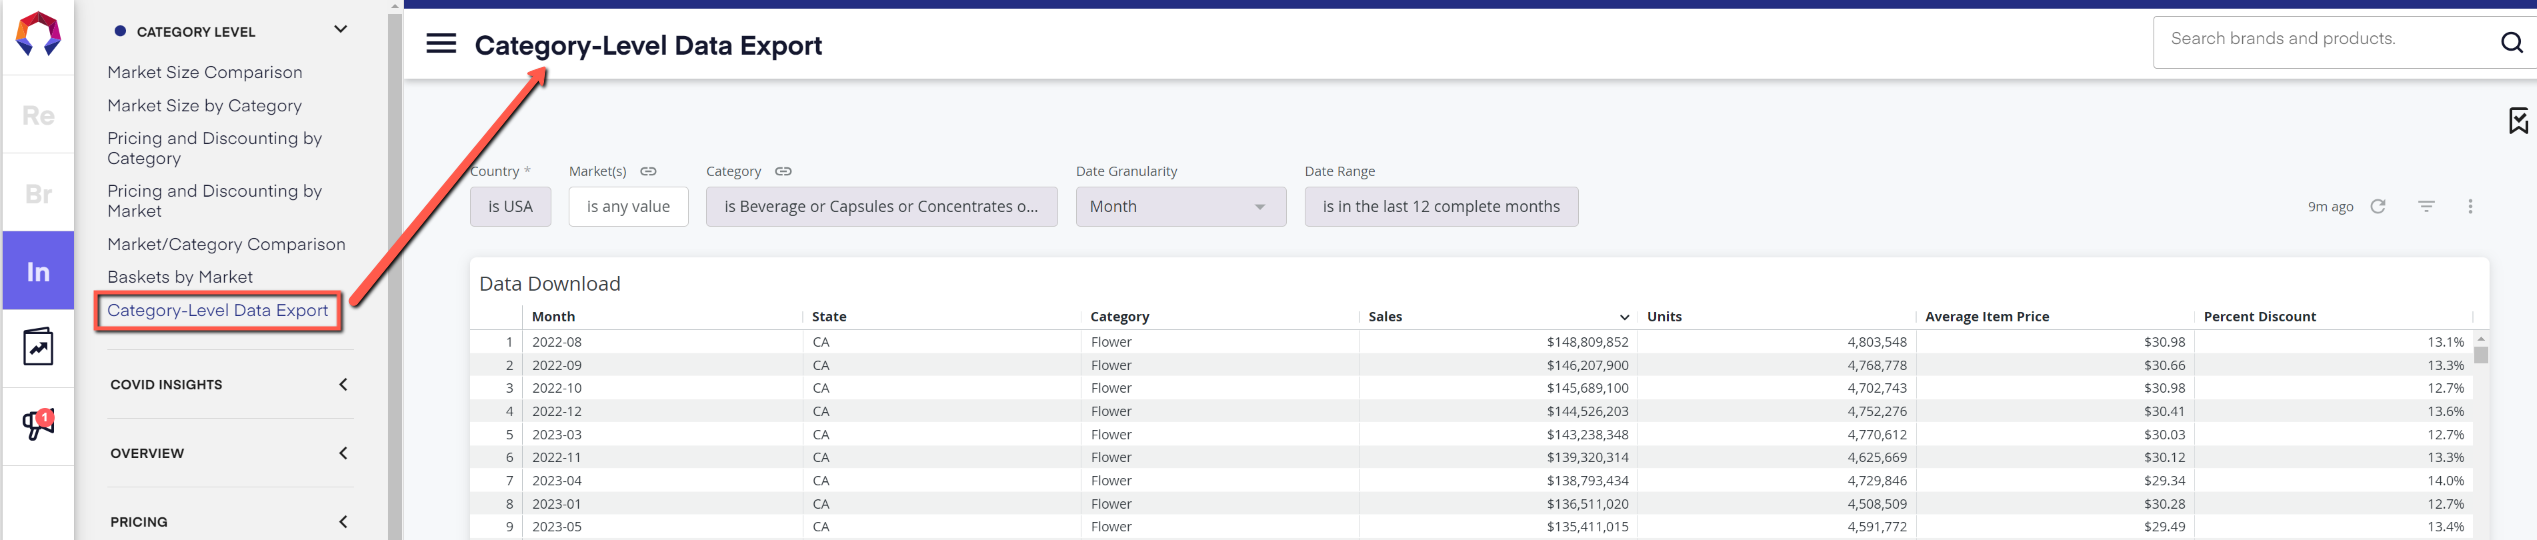
This table shows Date Granularity, State / Province, Category, Sales, Units, Average Item Price and Percent Discount which are visualized in various ways on the other dashboards within the CATEGORY LEVEL module. You can use this data for your own custom needs and to supplement the dashboards in this module.
About the Filters
To capture the data you need, leverage the filters at the top of the dashboard. Your filters will be limited to the markets you’re subscribed to but they will include all of Headset’s categories regardless of your subscription.
- Country = binary option for USA or Canada
- Sales dollars are reported in local currency based on your ‘Country’ selection
- Sales dollars are reported in local currency based on your ‘Country’ selection
- Market(s) = based on your subscription you may have 1 or multiple markets. Use the check boxes to select / deselect markets
- Date Granularity refers to how you’d like the data sliced (Monthly, Quarterly or Year)
- Tip: you can use ‘Year’ granularity to roll up multiple periods regarldess of your date range
- Tip: you can use ‘Year’ granularity to roll up multiple periods regarldess of your date range
- Date Range: select your custom time frame for your query
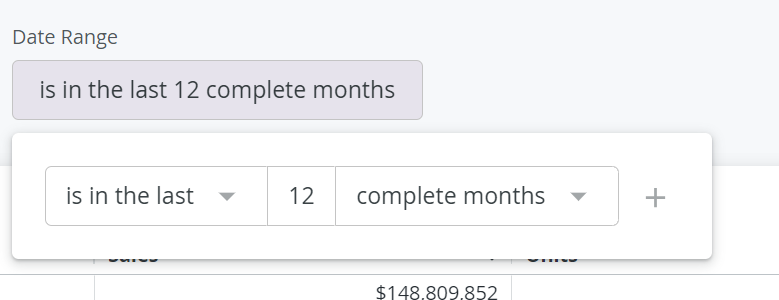
- Date Range defaults to “is in the last” however you can select more custom time frames to meet your needs by drilling into the drop down containing “is in the last”
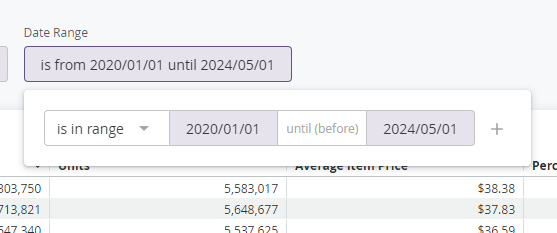
When selecting “in the Range” the filter is inclusive of your first date and exclusive of the second. If you’d like to pull data for January 2020 through the end of April 2020 your date range should be 2020/01/01 (until before) 2020/05/01 shown below:
Downloading the Data
Hover your mouse over the top right corner of the table and see the vertical ellipses.
NOTE When downloading a table only, you can expand the row limit to get a larger download****
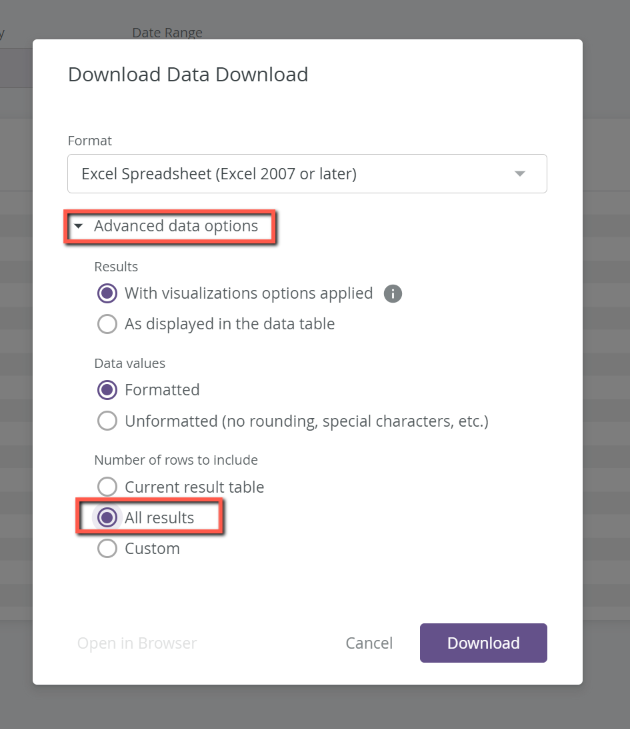
When you click download, a dialog box will pop up. Click on "Advanced Data Options" there.
To ensure a complete download, ALWAYS open ‘Advanced data options’, update ‘Number of rows to include’ to ‘All results’
Dashboard Tips & Tricks:
- When tracking trends over time, always generate a fresh report rather than exporting the most recent time frame and appending it to a previous report. Headset offers real-time dynamic data that evolves with new SKUs, updated state forecasting, and more. Please refer to "Best Practices for Using Real-Time Data" for further insights.
- If you export data regularly for routine reporting, consider scheduling the dashboard as an email CSV file to receive raw data in your inbox and receive reminders for reporting deadlines.
- Plan your deliverables before exporting data. For trend analysis, select a Monthly or Quarterly date range. For cumulative data over a period, use 'Year' granularity and allow the system to consolidate it.


