.png)
.png)


About this Dashboard
Overview of Market Trends
Utilize this dashboard to gain a comprehensive perspective on the markets where you operate or to track trends in markets beyond your current reach. The visual elements in this dashboard provide insights into category growth, year-over-year (YoY) and month-over-month (MoM) market growth, and facilitate quick comparisons between sales, units, and discounts.
In the examples below, we compare the markets of MA, MD, and MI.
Category Sales and Unit Sales by Market
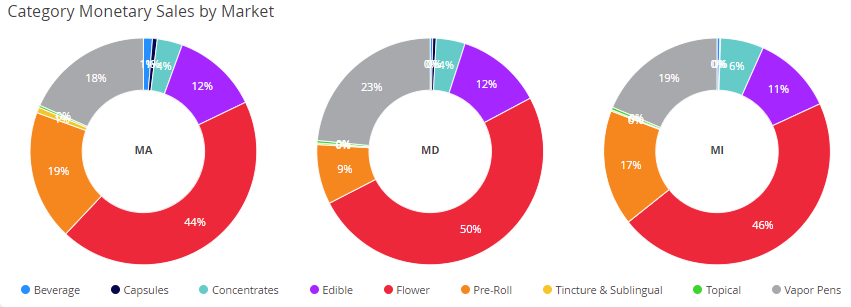
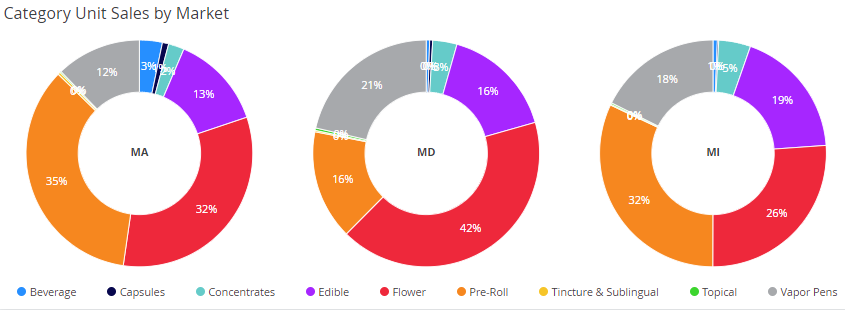
The first two visuals illustrate the monetary and unit sales of the entire market, categorized by product type. Observe the sales distribution in MA and MI, which show remarkable similarities, while MD exhibits distinct patterns with higher Vapor Pen sales and significantly fewer Pre-Roll sales.
Year Over Year and Month Over Month Growth
Next, let's examine the market trends on a month-to-month (MoM) and year-over-year (YoY) basis. The light blue bar represents the final complete month of the previous year, while the dark blue and seafoam green bars represent the last two complete months of the current year.
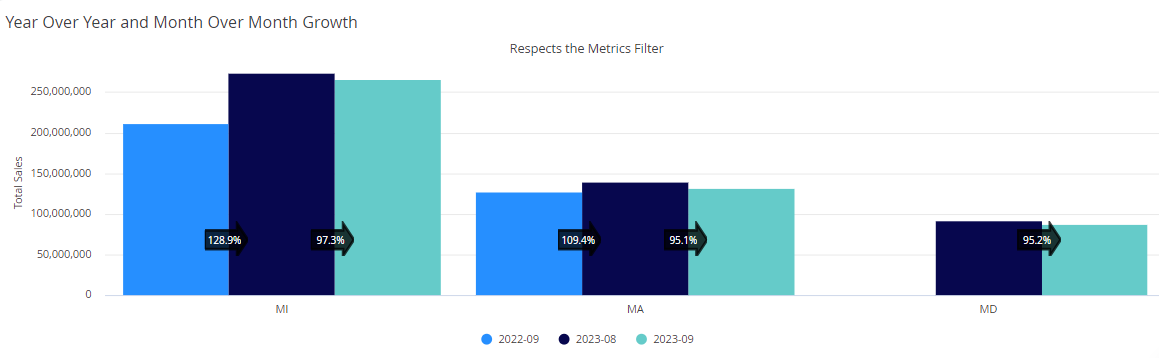
Click on the legend to toggle between the different metics. Note that the percentage in the arrows require a bit of math. We can see in MI the navy bar for August 2023 is higher than the seafoam green bar showing September of the same year. The market declined 6.3% (100 less 93.7). You can also export the data for easier math.
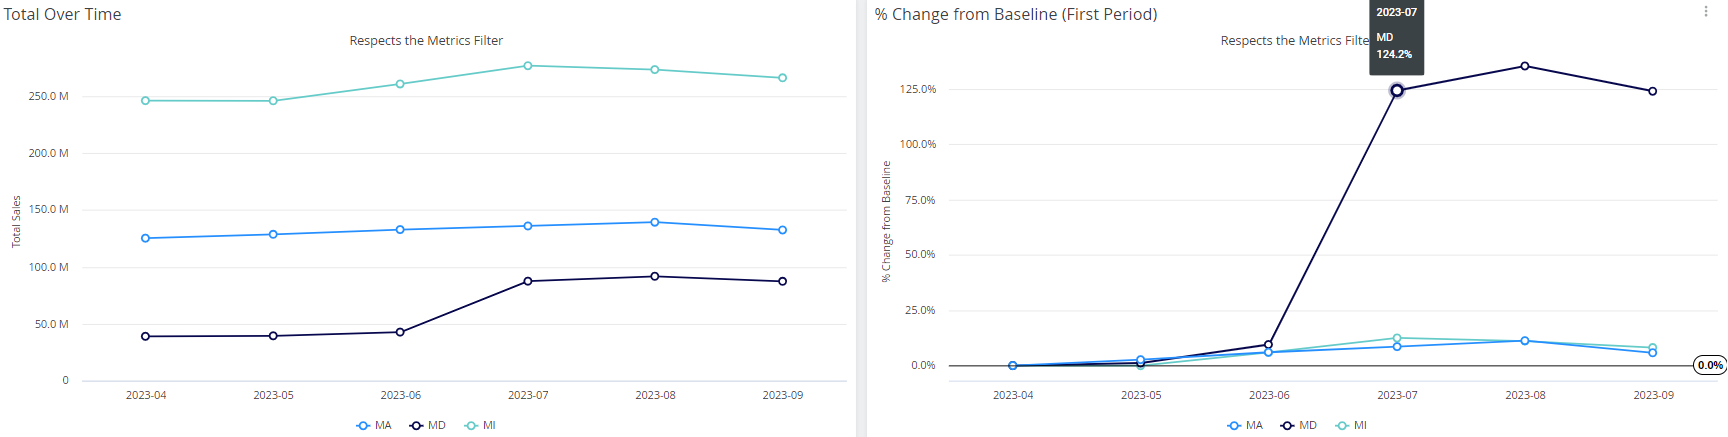
Total Sales Over Time and % Change from Baseline
With Maryland's transition to adult use, we witness a significant surge in sales, leading to substantial market growth. Compared to two more established markets, MD's total sales on a MoM basis are not far behind.
Sales, Units, and Discounts Comparison
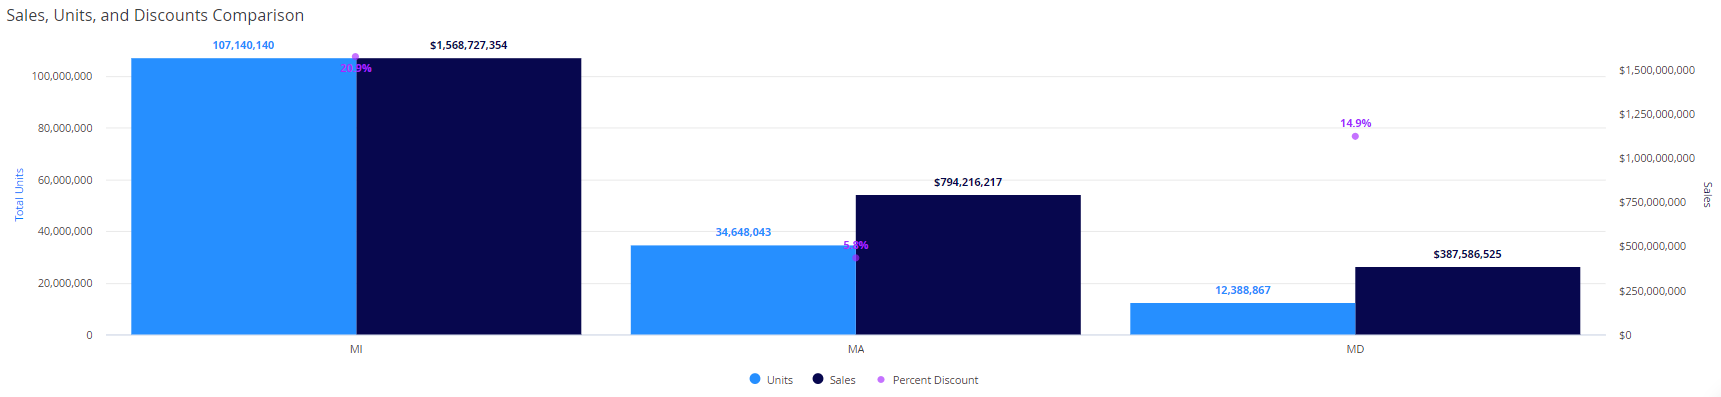
Lastly, at the bottom of the dashboard, you can observe an overall comparison of each market with regard to units, sales, and the percentage of discounts.