.png)
.png)


DATA DOWNLOAD EMAIL
The Data Download Email Report provides a detailed breakdown of your store’s performance, giving you the flexibility to filter, compare, and export key sales data.
At the top of the report, you’ll find several filters to tailor your data view:
-
Email Date Select
Choose the time frame you’d like to analyze. Options include:- This week vs. last week
- This month vs. the same month of the previous year
- MTD vs Last MTD
- YTD vs Last YTD
-
Store Filter
Select one or multiple stores to view. If left blank, the report will include data from all your connected store locations.
-
Summarize By
Choose how to group your data:
- Store – View results per individual store.
- City – Useful for analyzing performance across multiple stores in the same city.
- State – Aggregate results by state for a higher-level view.
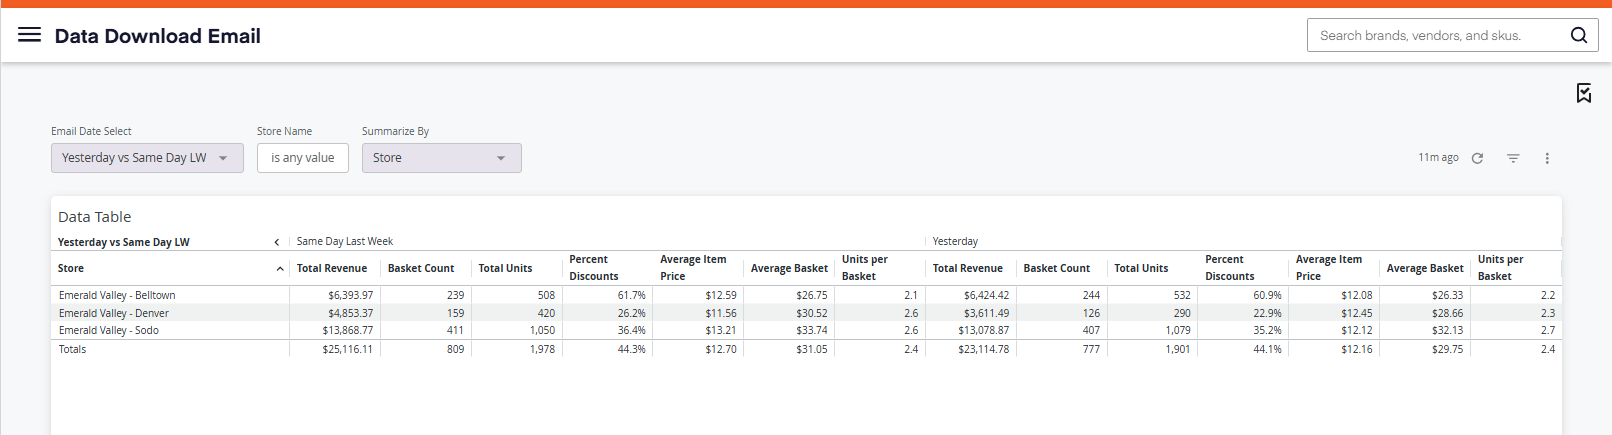
Once you run the report, a data table will appear. This table includes key performance metrics:
- Total Revenue
- Basket Count
- Total Units
- % Discount
- Average Item Price
- Average Basket
- Units per Basket
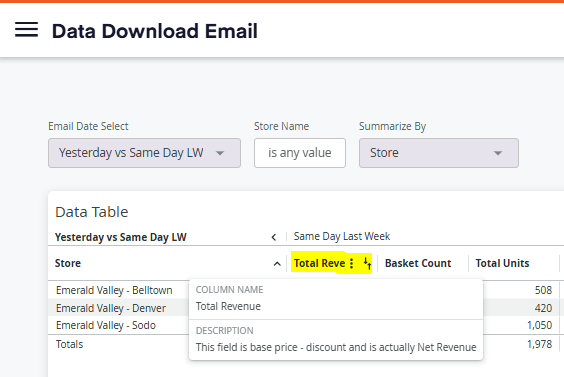
Hover for Definitions: Move your mouse over any column header to see a quick definition of that metric.
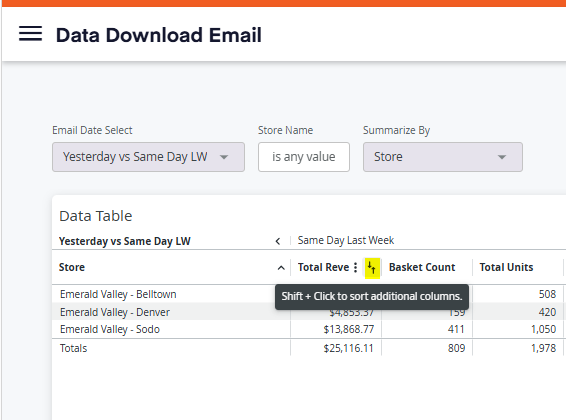
Sort Columns: Click the arrows in each column header to sort in ascending or descending order.
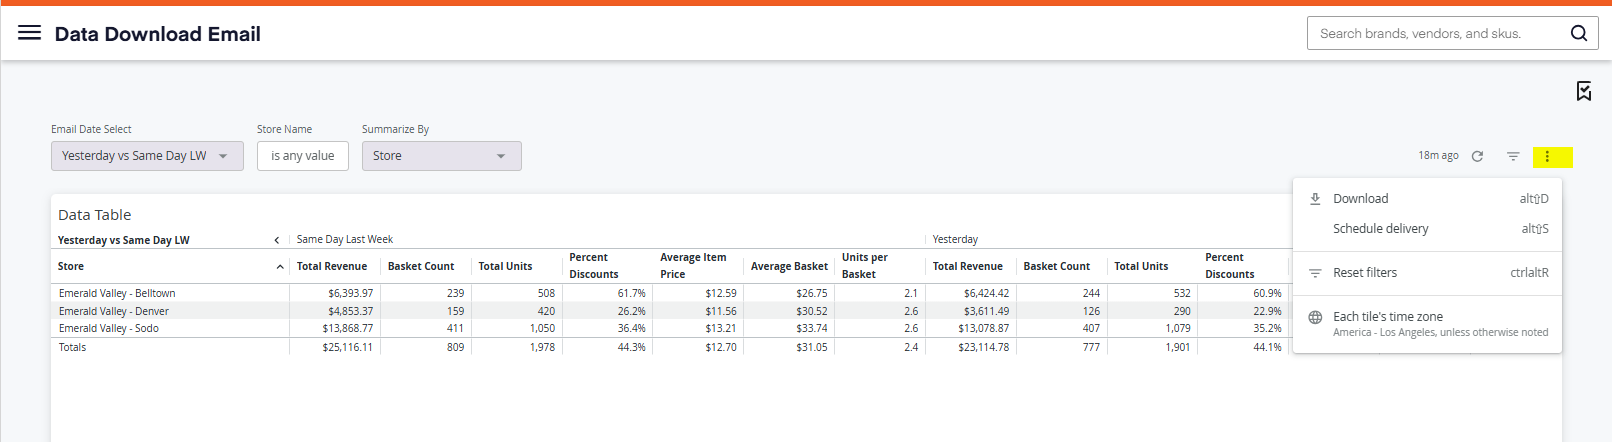
Export Options: Click the three dots in the top right corner of the report to either schedule it to be emailed to you on a recurring basis or download it directly as a file for offline use.