.png)
.png)


Year In Review
About this dashboard
The Year In Review dashboard was created to give you a opportunity to dive into your performance across the entire year.
The tables here allow you to drill in to dig deeper into your top categories, brands, and products.
Why would you want this?
Analyzing your previous years store performance allows you to make informed decisions for the future.
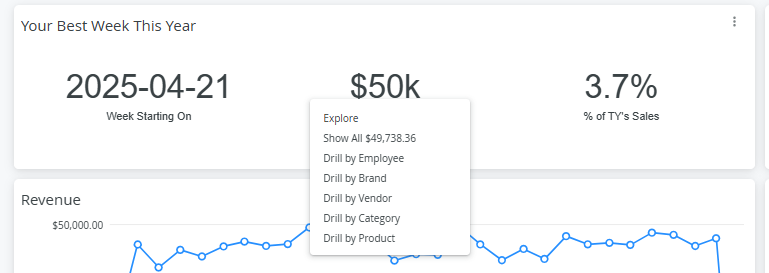
The first callout is centered around your top week and day of the year in your “year” filter.

By clicking on the total revenue you can drill in by various ways.
Sales by Budtender, Brand, Vendor/Distributor, Category, and Product.
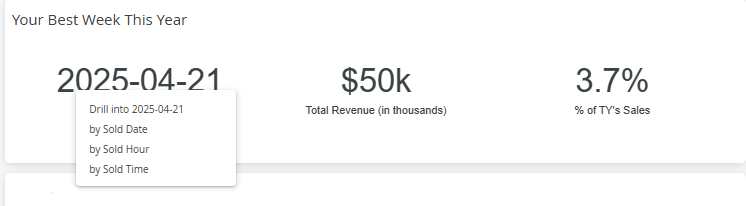
You can also drill into sales by hour or time.
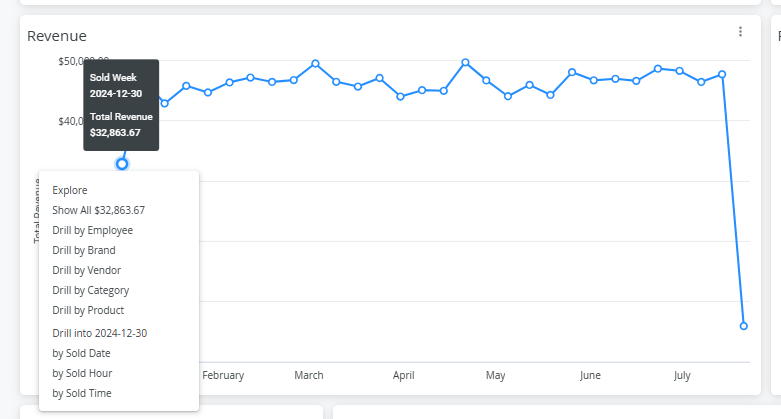
Revenue and Revenue Drivers allows the same option to drill in. Simply click on any bar or bullet point in these tiles.
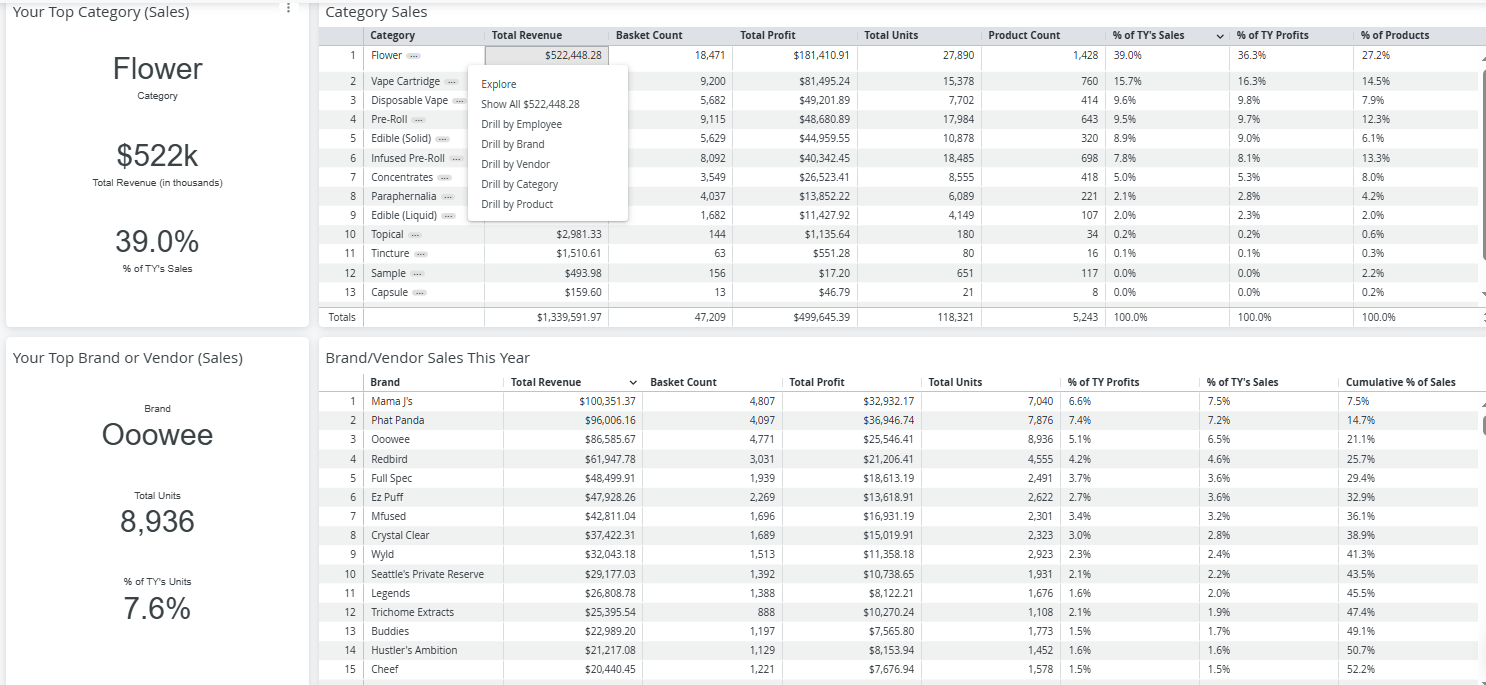
Analyze top categories and brands easily with the top category and top brand/vendor tiles.
Lastly, the top products table allows you to quickly view your top earning skus for the year.
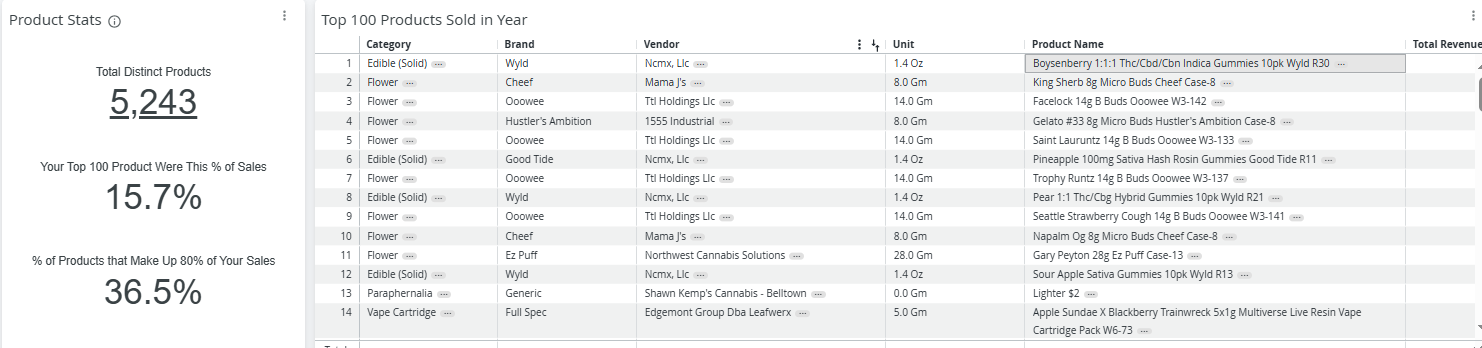
In this table you can click on any product name to look at details for that sku specifically.
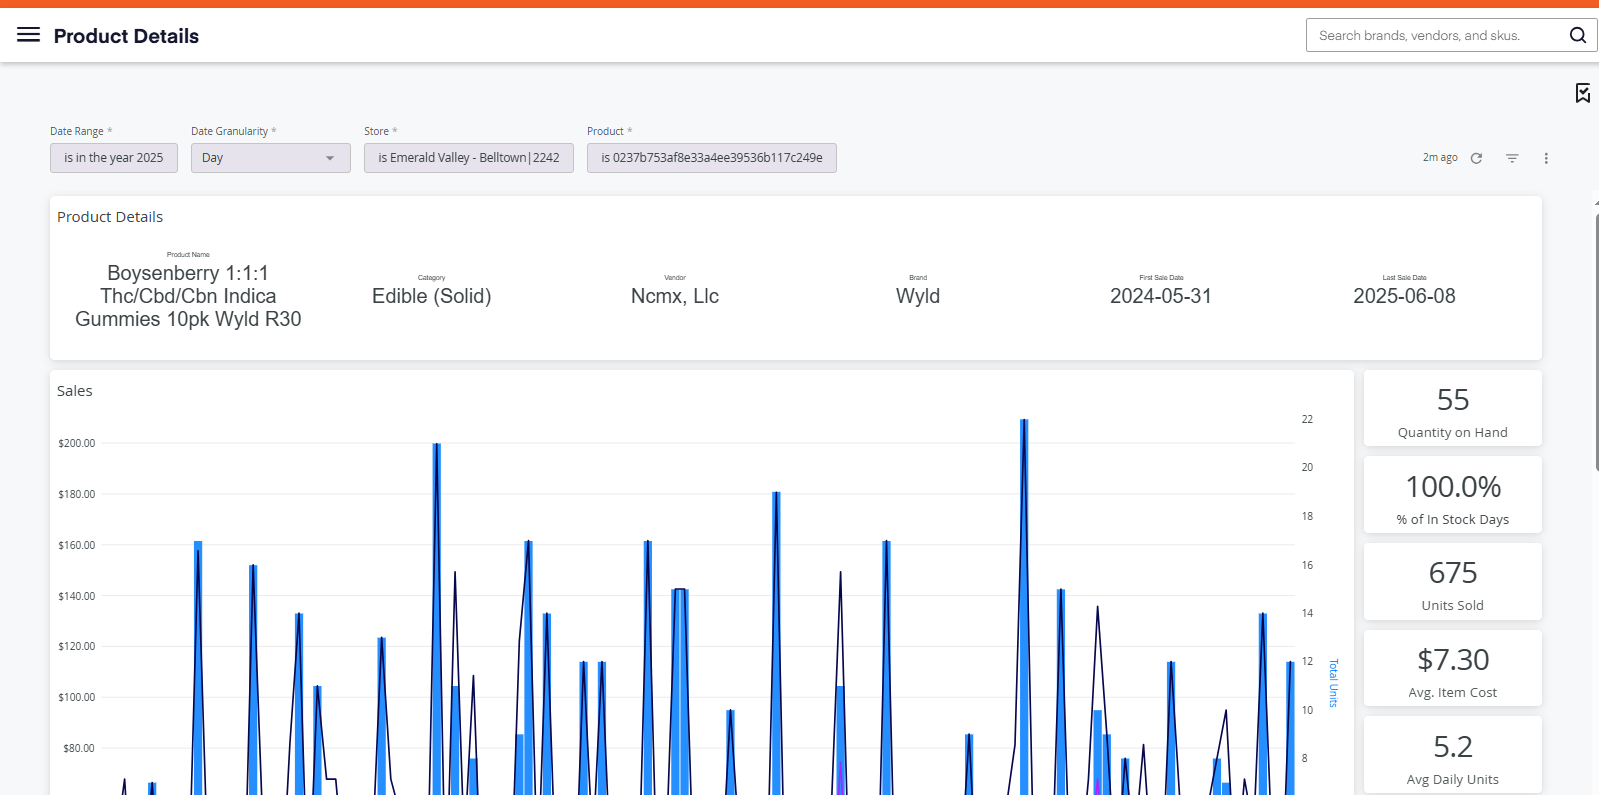
Analyzing past sales data will help your business operate more efficiently and drive profitability and growth in the competitive cannabis marketplace.


