.png)
.png)


Executive Overview
The Executive Overview Report provides a high-level snapshot of store performance across multiple time periods, helping you quickly identify trends, growth opportunities, and potential concerns.
-
Summarize By
This is the only filter on the report and allows you to choose how you'd like the results grouped:
- Store – View results for each individual store.
- City or State – If you operate multiple stores in the same region.
- Custom Groupings – If you've set up your own store groupings in the platform.
Yesterday vs. Same Day Last Week & Last Complete Week vs. Prior Week
Compare yesterday’s performance to the same weekday from the previous week.

Compare last complete week performance to the previous week.

- Metrics included:
- Total Revenue
- Total Units Sold
- Total Transactions
- Percent Discount
- A quick view of the trailing time period is also displayed below. Including green and red flags to highlight positive or negative trends.
Year-to-Date (YTD) & Month-to-Date (MTD) Performance
- Tracks revenue, units, and transactions for:
- Year-to-date
- Month-to-date

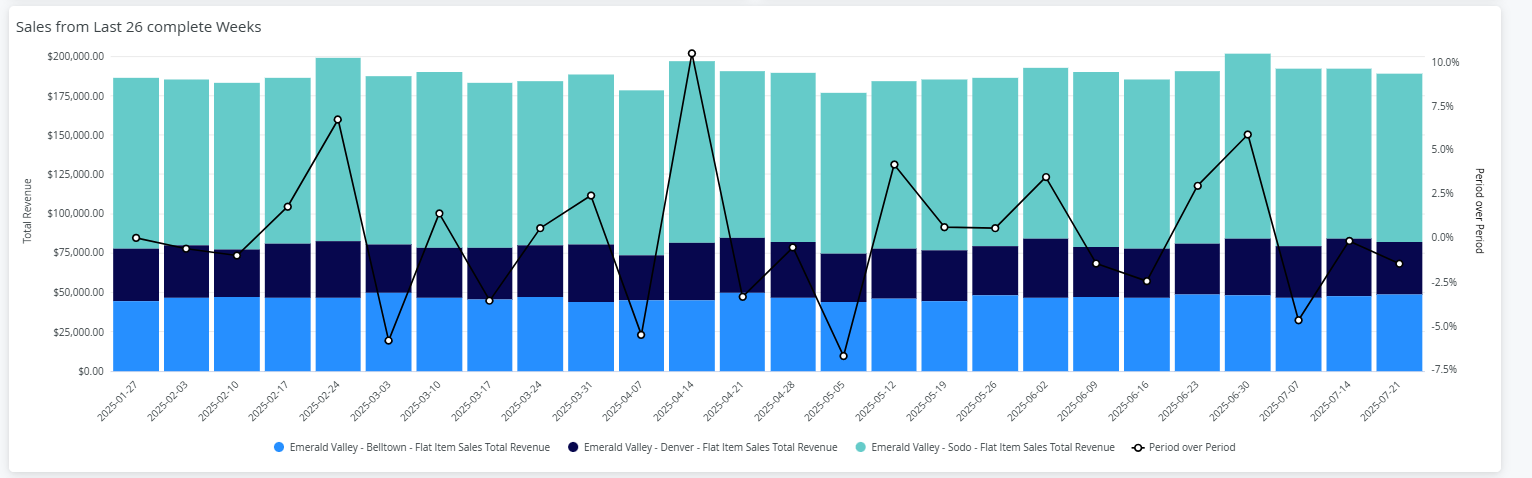
Last 26 Weeks of Sales
- A color-coded table showing weekly revenue by store for the past 26 completed weeks.
- A line graph visualizes period-over-period change, helping you spot growth trends or dips.
Hourly Sales – Last 12 Weeks
- Visual breakdown of hourly sales trends over the past 12 weeks.

Click on any of the date labels below the graph to hide specific weeks, making it easier to isolate and analyze a single week’s performance.

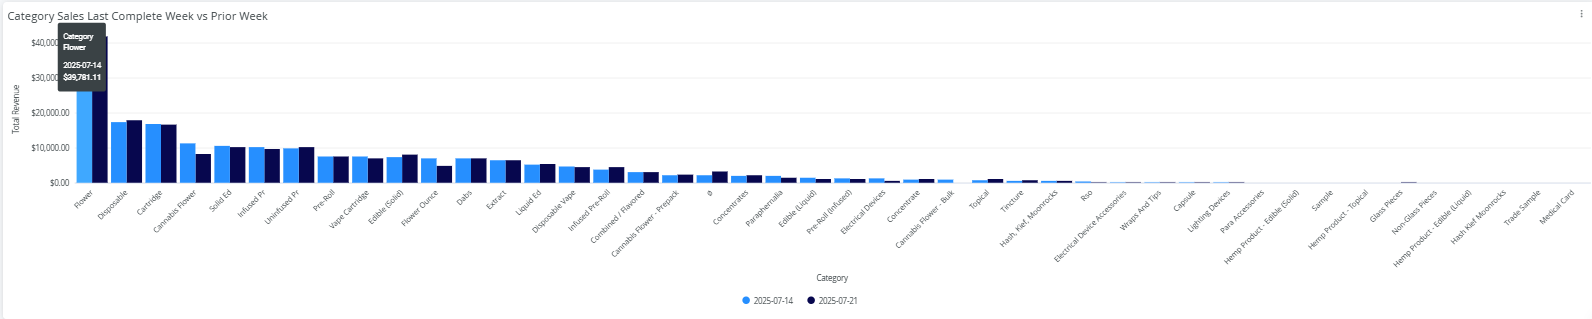
Category Sales – Last Complete Week vs. Prior Week
This bar graph shows total revenue by category. Offering a quick glance at category-level performance shifts week-over-week.
Hover over any bar to view specific revenue figures.